


Bargain Hunt or Bust? Will Banks Recover in 2024?
Bargain Hunt or Bust? Will Banks Recover in 2024?
When Will the Bears Retreat?

The Central Bank of Nigeria (CBN) issued a circular on March 28th, 2024 outlining the new minimum capital requirements for banks in the country. This is an ongoing effort to strengthen the financial system against potential risks. The table below summarises the new capital capital requirement for banks.

Recapitalization of banks refers to the process of increasing a bank's capital base by raising additional funds from shareholders, investors, or other sources. This is typically done to strengthen the bank's financial position, enhance its ability to absorb losses and comply with regulatory requirements.
Concerns about the dilution of existing shareholders' equity, potential losses, or the need for further restructuring are among the major drivers of investor sentiment.

The good times for FUGAZ banks seem to be over. While the NGX Banking Index initially rose 1.93% after the announcement, things have gone south since then. Notable bank tickers have suffered consecutive weekly losses, wiping out any gains made so far this year (YTD).
FBNH stands out as the only elephant in the room, being the only FUGAZ bank to close negative the week of the announcement, with a hefty drop of -8.02% WoW. Meanwhile, UBA, GTCO, Accesscorp, and Zenith Bank all managed positive WoW performances during that week. But it seems those gains were fleeting, as all the banks are now back in negative territory YTD.
The Bear's Roar

FBNH (-5.92% YTD) has been the top performer among the FUGAZ banking tickers, with UBA (-6.40% YTD), GTCO (-6.67% YTD), and Zenith (-12.51% YTD) trailing at a distance compared to the NGX Banking Index's (-12.84% YTD) performance. ACCESSCORP (-27.13% YTD) underperformed the index. Notably, all the banks have wiped out their gains for the year (January to April) and are now in negative territory year-to-date (YTD)

Elsewhere, our selected banks which consist of Stanbic IBTC Holdings (STANBIC), Wema Bank Plc (WEMA), and Ecobank Transnational Incorporated (ETI) showed a rather mixed performance. STANBIC started 2024 on a sour note with negative weekly returns (-5.96% WoW) on the first week of January even as the broader market enjoyed bullish momentum. This downtrend has continued, with STANBIC consistently posting negative weekly returns as of April 26th. The stock appears to be under sustained selling pressure since reaching its September 2023 peak of NGN79.40/share. Oversold technical indicators suggest a potential price floor between NGN39.50 and NGN42.00, where bargain hunters might emerge, assuming no major company announcements surface.

Wema Bank Plc (WEMA) the January highflyer, took a tumble, dropping more than -40.00% from its NGN12.50 peak in January to NGN6.25 in April. Frenzy buying in January pushed prices to unimaginable heights diverging significantly from its index return. Profit-taking in the absence of interested buyers triggered the price decline, and bargain-hunters were unable to establish lasting support despite temporary rebounds. The stock's current trajectory resembles a freefall, with no clear indication of when the drop might end. Wema's price might find equilibrium around NGN5.25, a potential confluence point where buyers might reappear, again assuming no company announcements impact the stock.
Bank Stocks now with More Up-And-Down Than a Toddler on Sugar!

While the broader market seems to be finding its footing, bank stocks have been exhibiting some unusual behaviour. Their performance has been...well, has been more erratic than a toddler on a Pixy Stix bender, leaving investors wondering if they've stumbled into a game of financial whack-a-mole. But before you hit that sell button out of frustration you need to understand what’s ahead for the banks in the coming months.
Looking back, we can see that banks have had a good start to the year though Stanbic woke up to the year on the wrong side of bed and is still unable to reduce any of its losses for the year. The stock has been drowning in the Red Sea with no sign of a lifeboat. On the other hand, FBNH had a stellar first quarter, with 3 consecutive positive monthly returns though April became its first losing month for the year, consequently wiping out those gains made so far.

The first half of May will shape up to be a tug-of-war between the bulls and bears. While a dramatic price surge might not be in the cards just yet, expect some valiant efforts from the bulls to prevent a complete meltdown.
Think of it like a boxer taking a breather in the first round, regrouping before a knockout blow later. Our "FUGAZ tickers" (you know, those formerly high-flying bank stocks) might show some signs of life by the end of May.
But the real game changer? Buckle up for the H1:2024 financial reports. These will be the ultimate judges, holding the key to whether our bank buddies bounce back or stay stuck in the ropes. So, keep an eye on those reports, because Q3 might just be where the real fight begins!
Fundamentals as a Bear-Proof Tool for Your Portfolio
The Naira depreciated in 2023 by 96.55% year-on-year as the dollar was quoted at N907.11 at the end of the year (according to NAFEM). This benefited the banks as they made substantial revaluation gains and acted as support for the continued bullish sentiment experienced at the beginning of the year.
Consequently, the CBN stopped the banks from using FX revaluation gains to pay dividends or meet operating expenses. The implication of this is that in the short term, banks will likely see a decrease in their reported profits. These gains would have otherwise added to their bottom line, but now they must be held in reserve. This could impact dividends paid to shareholders and potentially limit resources available for operating expenses.
Gross Earnings are expected to grow in Q2 and Q3 2024 supported by the hawkish stance of the apex bank
According to
, a leading Nigerian banking analyst, non-FUGAZ banks (including our selected banks) are expected to see rising earnings. This is because they have a smaller net open position in foreign currency compared to the FUGAZ banks, which are more involved in the international financial space. He highlighted that the FUGAZ banks' larger net open position exposed them more significantly to both foreign exchange gains and losses in the previous fiscal year (2023). In contrast, non-FUGAZ banks primarily generate their earnings from interest income.Furthermore, Simon points to the CBN's recent tightening measures, including raising the Cash Reserve Ratio (CRR) and influencing the Loan-to-Deposit Ratio (LDR). While these measures might slightly reduce overall lending activity, they also strengthen the banking system. The reduced risk of issuing loans to borrowers with poor creditworthiness (subprime lenders) is balanced by the current high-interest environment. Simon estimates that roughly 70% of bank profits currently come from interest income. Based on these trends, he expects the CBN to raise the Monetary Policy Rate (MPR) further, which would likely lead to even higher interest income for banks.
Given these insights from
, we want to take advantage of the market by positioning ourselves before the market rebounds. Here are our criteria for selecting the stocks in our banking portfolio using the factor weighting methodology.P/B ratio — Unlike the price-to-earnings (P/E) ratio that emphasizes profitability, P/B directly compares a bank's market value (share price) to its book value (net assets on the balance sheet). This provides insight into how much investors are willing to pay for a bank's core assets, like loans and securities, compared to their accounting value. P/B allows for easy comparison between banks. Banks with a higher P/B ratio are generally considered more efficient at managing their assets and generating returns. This helps investors identify potentially undervalued banks that might be good investments.
EPS growth — EPS growth represents the percentage change in a company's EPS over a specific period, usually compared year-over-year. So, it shows how quickly a company's profitability is increasing on a per-share basis. Investors are generally interested in companies with consistent and positive EPS growth. This indicates a company's ability to generate more profit over time, which can translate to a higher stock price.
Dividend Yield — Dividend yield is a financial ratio that tells you the percentage of a company's current stock price that it pays out in dividends each year. It's a metric used to assess an investment's income potential. A higher dividend yield indicates a larger portion of the stock price is paid out as dividends. However, a lower dividend yield indicates a smaller portion of the stock price is paid out as dividends.
This is not an exhaustive list of criteria that can be used. However, we try to keep things as simple as possible by picking what we think is optimal for this portfolio at the time of creating it. Additionally, the banks in our selection have strong fundamentals and are expected to be profitable in the long term, driving value for investors.
Factor Portfolio Methodology
Focused on the Nigerian Stock Exchange (NGX) Banking Index for potential investments.
Narrowed down to the "FUGAZ" banks (popular banking stocks) and further selected specific companies: Stanbic, ETI, and Wema (SEW).
Collected a year's worth of weekly price data for each chosen stock.
Calculate the weekly returns for each stock.
Used the weekly return data to determine the average annual return for each stock over the past year. Compare the returns of each stock to the overall NGX Banking Index using beta to assess individual stock volatility relative to the broader banking sector.

The table revealed that Accesscorp, Wema, FBNH, and ETI exhibited higher volatility compared to the NGX Banking Index. To confirm this initial assessment, we conducted further analysis to quantify the variations in returns for each stock compared to the index's average return.

Collect the P/B ratio, the 5-year weighted average of earnings growth, and the dividend yield. This is the factor score.

Normalise the factor scores using the standardization method.

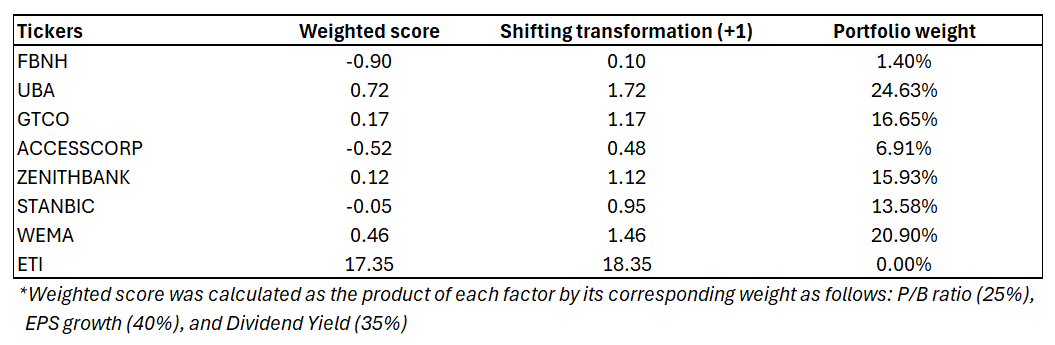
Compute the weighted score for each stock by summing all the individual scores for each stock. Use shifting transformation to eliminate negative weighted scores.
Divide the result of each shifted transformation above by the sum of all the transformations to arrive at portfolio weight.

Estimating expected beta and expected return of portfolio
Compute the adjusted beta for each stock using the Bloomberg methodology. Adjusted beta is a forward-looking measure that uses the historical beta as an input. The formula for adjusted beta assumes that a security’s beta moves toward the market average (1.00) over time.

The expected return of the portfolio is calculated as the sum of the weighted return of each stock in the portfolio.

Final Thoughts
Despite the downtrend, we price depreciation to plateau from mid-May and a subtle trend reversal from the last week in May. More support for price gains would come from H1 reports and we expect an increase in earnings to be driven by interest income. Find below a summary of our estimated target price for each stock. Until next time… Hasta lavista!!!!!!

Disclaimer
This information is for educational purposes only and should not be used as a proxy for financial advice. Always consult with your investment advisor before making any investment decisions. The stock market is subject to volatility and may not be suitable for some investors. Also, past performance is not an indication of future returns.
An interesting read!
Thank you Flourish.